
Guidance
- Role of the uncertainty assessment process
- Keeping a List of Uncertainties: Companies that want to measure and report their GHG emissions need to keep a list of things they are not entirely sure about, or uncertainties. These uncertainties could be anything that might affect the accuracy of their measurements.
- Why Keep a List of Uncertainties: This list helps in three main things:
- Facilitating Uncertainty Assessment: It helps the company figure out how much uncertainty exists in their measurements.
- Assurance: This means making sure that the GHG inventory is reliable and accurate.
- Reporting Processes: It’s about communicating this information to others, like stakeholders or the public.
- Facilitating Uncertainty Assessment: It helps the company figure out how much uncertainty exists in their measurements.
- Qualitative and Quantitative Assessments:
- Qualitative Descriptions: When reporting, companies often describe uncertainties using words. For example, they might say “high,” “medium,” or “low” uncertainty.
- Quantitative Assessments: This involves using numbers to measure uncertainty more precisely. This helps companies figure out which parts of their data need improvement the most and understand how their methods affect the overall results.
- Qualitative Descriptions: When reporting, companies often describe uncertainties using words. For example, they might say “high,” “medium,” or “low” uncertainty.
- Qualitative and Quantitative Assessments:
- Why Quantitative Approach is Useful:
- Prioritizing Data Quality Improvement: It helps companies focus on fixing the parts of their data that contribute the most to uncertainty.
- Understanding Methodological Choices: Companies can see how the methods they use to measure emissions impact the overall results.
- Adding Clarity and Transparency in Reporting: Using numbers makes it clearer and more transparent when telling others about the uncertainties in their GHG inventory.
- Prioritizing Data Quality Improvement: It helps companies focus on fixing the parts of their data that contribute the most to uncertainty.
- Why Quantitative Approach is Useful:
- Where to Find Detailed Guidance: Companies can get guidance on how to measure and report uncertainty by visiting a specific website: (www.ghgprotocol.org). This website likely provides detailed instructions or rules on the best practices for handling uncertainty in GHG inventories.
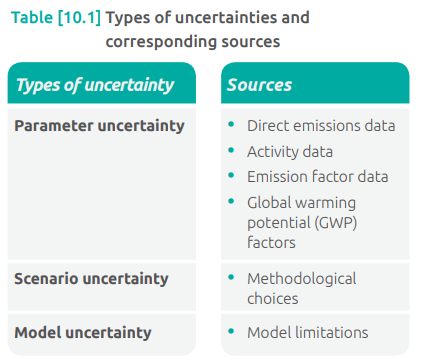
2. Types of uncertainty
Three Types of Uncertainty:
- Parameter Uncertainty: This uncertainty is about whether the values used in the inventory accurately represent the processes or activities in the product’s life cycle. It can be related to emissions data, activity data, and emission factors.
- Example: If the data used to calculate the emissions from producing plastic for a toner cartridge is based on limited information, there is uncertainty about the accuracy of the emission factor.
- Propagated Parameter Uncertainty: This is the combined effect of uncertainties in individual parameters on the overall inventory result. It can be calculated using methods like random sampling (Monte Carlo method) or analytical formulas (Taylor Series expansion method).
- Example: If a company calculates that their printer cartridge product results in 155 kg CO2e emissions per unit, with individual uncertainties, using the Monte Carlo method might show that the true value is likely between 140 and 170 kg CO2e with 95% confidence.
- Example: If the data used to calculate the emissions from producing plastic for a toner cartridge is based on limited information, there is uncertainty about the accuracy of the emission factor.
- Scenario Uncertainty: While parameter uncertainty deals with how close the data used in calculations are to the actual data, scenario uncertainty is about variations due to different methodological choices. Standards help reduce scenario uncertainty, but variations can arise when there are multiple methodological choices.
- Example: The choice of allocation methods, product use assumptions, and end-of-life assumptions can introduce scenario uncertainty. Varying these choices in a scenario analysis can show how they impact inventory results.
Examples of Scenarios: Varying the way electricity consumption is allocated between production lines or considering different recycling rates for toner cartridges.
- Example: The choice of allocation methods, product use assumptions, and end-of-life assumptions can introduce scenario uncertainty. Varying these choices in a scenario analysis can show how they impact inventory results.
Model Uncertainty: This arises from limitations in how well the modeling approaches used reflect the real world. Models simplify the real world into numeric representations, introducing some inaccuracies.
- Example: A model predicting emissions from soy production for ink may assume a linear relationship between nitrogen fertilizers and emissions. If the real-world interactions are more complicated, there is uncertainty about the accuracy of the emissions predicted by the model.
- Parameter Uncertainty: This uncertainty is about whether the values used in the inventory accurately represent the processes or activities in the product’s life cycle. It can be related to emissions data, activity data, and emission factors.
3. Reporting qualitative uncertainty
- What Companies Need to Report: Companies have to report on two main things:
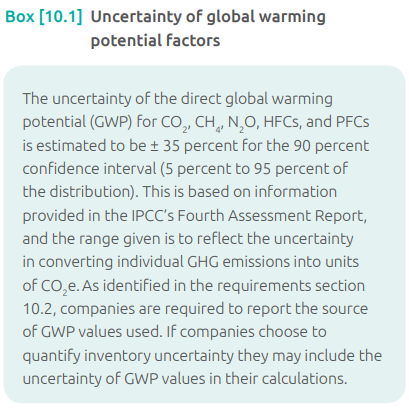
- Qualitative Description: They need to use words to describe the uncertainties and the choices they made in their inventory process. This includes details about how they handle the entire life cycle of a product (from creation to disposal), how they allocate resources, what global warming potential (GWP) values they use, and what models they use to calculate emissions.
- Examples of What to Report:
- Life Cycle Profiles: Information about the entire life cycle of a product.
- Allocation Methods: How resources are distributed among different parts of the product’s life cycle.
- Source of GWP: Where they get the values for global warming potential.
- Calculation Models: The methods used to calculate emissions and removals.
- Examples of What to Report:
- Quantitative Uncertainty Assessment (Optional but Desirable):
- Not Required, but Desirable: Companies are not obligated to provide specific numbers to show how uncertain their measurements are, but it’s a good idea to do so if possible.
- Why It’s Useful: Quantitative assessment, using numbers, can give a stronger and more reliable result. It helps pinpoint exactly where there might be high uncertainty in the measurements.
- Not Required, but Desirable: Companies are not obligated to provide specific numbers to show how uncertain their measurements are, but it’s a good idea to do so if possible.
- What Companies Can Choose to Include in Reports:
- Both Qualitative and Quantitative Information: Companies can choose to include both types of information in their reports. This means they can use words to describe uncertainties and also provide numerical assessments if they have them.
- Efforts to Reduce Uncertainty: Companies can also talk about what they’re doing to make their measurements more certain in the future. This might involve improving data collection methods or using better models.
- Both Qualitative and Quantitative Information: Companies can choose to include both types of information in their reports. This means they can use words to describe uncertainties and also provide numerical assessments if they have them.

4. Uncertainty in comparisons
- Comparing Uncertainty in Greenhouse Gas (GHG) Inventories: Sometimes, we want to compare the environmental impact of different products or stages in a product’s life cycle. This comparison involves dealing with uncertainties, but it’s done a bit differently.
- Comparative Uncertainty Overview:
- Different from Previous Uncertainties: Comparative uncertainty involves looking at more than one product or system, unlike the uncertainties we discussed earlier.
- Not for Product Comparison Beyond Performance Tracking: The goal is not to compare products for marketing or competitive purposes. Instead, it’s mainly for tracking and understanding the environmental performance of products.
- Within a Single Product Inventory: Even when looking at one product, there might be uncertainties when comparing the impact of one process or stage to another within that product’s life cycle.
- How to Handle Uncertainty in Comparisons:
- Don’t Directly Compare Uncertainty Ranges: When comparing two products or stages, you shouldn’t directly compare the uncertainty ranges of each. Instead, focus on assessing the uncertainty in the comparison itself.
- Example: Instead of comparing the uncertainty of Product A to Product B, you might assess the uncertainty in the ratio of A divided by B.
- Applicable to Parameter and Scenario Uncertainty: This method can be used for both types of uncertainty.
- Consider Common Elements in Comparisons:
- Common Inputs, Outputs, and Processes: When comparing two or more things, it’s essential to track if they share common elements, like materials, processes, or outputs.
- Correlated Uncertainties: If the items being compared have common elements, their uncertainties might be connected or correlated. In this case, you shouldn’t include this correlation in the uncertainty comparison result.
- Importance of Identifying Correlations: Recognizing correlations is crucial for monitoring changes in a product’s inventory over time.
- Example to Illustrate:
Toner Cartridge Manufacturer Example:
- The manufacturer of a toner cartridge calculates that the parameter uncertainty in their product’s inventory is +/- 20 percent.
- The company develops a new design with a lighter cartridge body, reducing the weight by 30 percent and the total product inventory by 3 percent.
- Despite the weight difference, the processes and data sources for both the original and revised inventories are the same.
- Therefore, even though both inventories have a parameter uncertainty of +/- 20 percent and the difference in results is 3 percent, the company can be confident that the new design has a lower greenhouse gas impact.

