Guidance:
Companies should follow the steps below when collecting data and assessing data quality:
Step 1. Develop a data management plan and document the data collection and assessment processes as they are completed
Step 2. Identify all data needs using the product’s process map
Step 3. Perform a screening to help focus data collection efforts
Step 4. Identify data types
Step 5. Collect primary data for all processes under the ownership or control of the reporting company
Step 6. For all other processes, collect primary or secondary data. Assess and document the data quality of the direct emissions data, activity data, and emission factors as the data are collected
Step 7. Improve the data quality, focusing on processes that have a significant impact on the inventory results.
1. Data management plan
Imagine you’re running a business and you need to keep track of information about your products. This information could include things like where you get the data from, what assumptions you’re making about the data, and how reliable the data is.
A data management plan is like a guide or a tool that helps your company organize and keep a record of all this information about your products. It’s important because it helps you do a few key things:
- Organize Data Collection: It helps you figure out where your information is coming from. Is it from sales records, customer feedback, or some other source? This plan helps you keep everything in order.
- Document the Process: You write down how you’re collecting the data. This includes any assumptions or guesses you’re making along the way. For example, if you estimate the number of products sold in a certain region, that’s an assumption, and it should be noted.
- Improve Data Quality: By keeping track of where your data comes from and how you’re collecting it, you can find ways to make it better. If you notice errors or uncertainties, you can fix them over time.
- Prepare for Assurance: This means making sure that your data is reliable and trustworthy. If someone, like a boss or a customer, asks where your information comes from, you can show them your data management plan to prove that you’re doing things in a careful and organized way.
- Adapt to Changes: Products and businesses change over time. The plan helps you update your records to reflect these changes. For instance, if you start selling a new version of a product, your plan should be updated to include information about this new version.
To make sure you’re not missing any important details, it’s best to create this data management plan early on, especially when you’re starting to keep track of your products and their information.
2. Identifying data needs
The attributable processes identified during boundary setting and in the process map provide a basis for the list of data that needs to be collected. The data management plan can also be used to organize attributable processes if it is not possible to include them all in a process map.
3. Data screening
Imagine a company wants to understand and manage the environmental impact of its products throughout their entire life cycle. This guidance is talking about a method that helps the company figure out where to focus its efforts in collecting data for this purpose.
- Screening Processes Based on Contribution:
- The company wants to focus on the most important aspects of its products’ life cycle.
- They’re suggesting a method where they estimate how much different processes contribute to the overall environmental impact.
- This doesn’t have to be done, but it can be really helpful. It might reveal unexpected information and help the company use its resources more efficiently.
- How to Perform Screening Effectively:
- The best way to do this screening is by estimating emissions and removals using existing data.
- They suggest ranking these estimates to see which processes have the biggest impact on the product’s life cycle.
- This ranked list then helps the company decide where to focus its data collection efforts.
- Prioritizing Data Collection:
- If a company decides not to estimate emissions during screening, they should at least focus on processes known to use or produce a lot of environmentally impactful energy or materials.
- Assessing Uncertainty:
- It’s also important to consider how certain or uncertain the estimated data is.
- If a process has a big impact but the data is uncertain, it becomes a high priority for data collection.
- Additional Criteria for Data Collection Priorities:
- Some processes might be important for reasons other than emissions.
- Companies might also consider:
- How much money is spent on a particular process compared to others.
- Processes where the company can reduce emissions.
- Processes controlled by suppliers who are crucial to the company.
- Any other criteria specific to the company or industry.
4. Identifying data types
- Identifying Data Types in an Inventory:
- When a company is keeping track of information about its products and their environmental impact (inventory), it’s important to know what kinds of data are being used.
- Knowing the types of data helps the company understand the information better and judge how reliable it is.
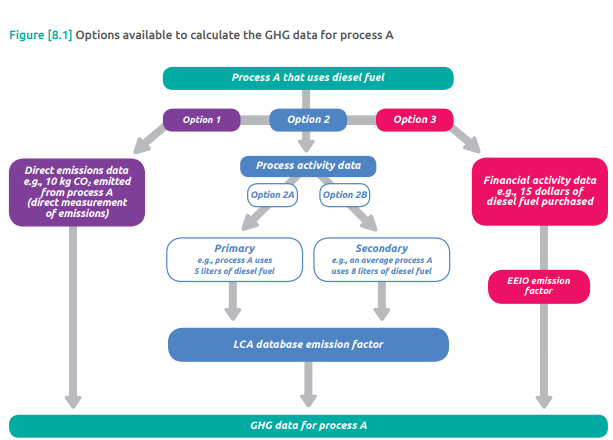
- Two Ways to Gather Data: There are two main ways to collect data for the inventory:
- Direct Measurement or Modeling: This means directly measuring or estimating the emissions released from a process. For example, if a factory emits carbon dioxide, you could measure it directly or use a model to estimate how much is being released.
- Collecting Activity Data and Emission Factors: This involves gathering information about the activities happening (like production processes) and using emission factors to calculate the emissions. An emission factor is a number that helps convert activity data into emissions data.
- Documenting Data Sources: The places where the company gets its data (data sources) should be written down in a document called a data management plan. This plan is like a guide that helps the company keep everything organized.
The standard suggests documenting three types of data:
- Direct Emissions Data:
- This type of data comes directly from monitoring the emissions released during a process.
- Methods to determine direct emissions include continuous monitoring systems, stoichiometry (a method involving chemical equations), mass balance, or similar approaches.
- Examples could be emissions from an incinerator measured by a continuous emissions monitoring system or calculating emissions from a chemical reaction using stoichiometry.
- Activity Data:
- Activity data is a measure of the level of activity that leads to greenhouse gas (GHG) emissions.
- There are two main categories of activity data: process activity data and financial activity data.
- Process Activity Data: These are physical measures related to a process that results in GHG emissions. Examples include energy consumed, mass of materials, volume of chemicals used, area of a production facility, distance traveled, and hours of operation.
- Financial Activity Data: These are monetary measures related to a process that leads to GHG emissions. These can be combined with financial emission factors to calculate GHG emissions.
- Financial Activity Data Example:If a company knows the cost of fuel consumed in a process and the cost per liter of fuel, it can convert the financial data into physical activity data, such as the amount of liters consumed in the process.
- Emission Factors:
- Emission factors tell us how much greenhouse gas is emitted per unit of activity data.
- Emission factors can cover a specific greenhouse gas (e.g., methane per liter of fuel) or include multiple gases in units of CO2 equivalents.
- They are multiplied by activity data to calculate GHG emissions.
- Examples of emission factor sources include life cycle databases, published product inventory reports, government agencies, industry associations, company-developed factors, and peer-reviewed literature.
- Understanding Emission Factors: Emission factors can cover specific processes or include multiple processes aggregated together. Life cycle emission factors covering all upstream processes are often called cradle-to-gate emission factors.
- Companies need to understand which processes are included in the emission factors to ensure that all processes in the product’s life cycle are considered in data collection.
- Selecting Emission Factors: The types of emission factors needed depend on the type of activity data collected. For example, if a company collects financial activity data on a material input, they might use an environmentally extended input-output (EEIO) emission factor to calculate upstream emissions.
- Companies can choose to collect emission factors first and then decide which types of activity data to collect based on the available emission factors.
- Direct Emissions Data:
5. Collecting primary data
- Primary Data Definition:
- To meet a certain standard, companies need to collect primary data for all the processes they own or control.
- Primary data are specific details about the processes involved in making a product.
- Examples of Primary Data:
- Liters of fuel used by a process, either from one specific location or an average across all locations.
- Kilowatt-hours of electricity used by a process from one site or an average across sites.
- Kilograms of materials added to a process.
- Greenhouse gas (GHG) emissions from the chemical reactions of a process.
- Classification of Primary Data:
- Both direct emissions data and process activity data (like liters of fuel, kilowatt-hours, etc.) can be classified as primary data if they meet the definition.
- Emission factors, which are used to calculate GHG emissions, are not classified as primary or secondary, regardless of where they come from.
- Importance of Collecting Primary Data:
- Even if a company doesn’t own or control certain processes, it’s beneficial to collect primary data for those processes. Here’s why:
- Transparency and Accountability: Collecting primary data from suppliers along the product’s life cycle makes the entire process more transparent and holds everyone accountable.
- Reflecting Changes: Primary data is better at showing changes in emissions due to operational adjustments made to reduce emissions. Secondary data sources might not capture these changes accurately.
- Effective Tracking and Reporting: Collecting primary data allows companies to track and report progress more effectively towards their goals of reducing greenhouse gas emissions.
6. Collecting secondary data
- Secondary Data Definition:
- Secondary data are information that doesn’t come from specific processes in the product’s life cycle.
- If direct emission data or process activity data doesn’t meet the criteria for primary data, it is classified as secondary.
- Financial activity data is always considered secondary and can’t be used to meet the primary data collection requirement.
- Examples of Secondary Data:
- Average number of liters of fuel used by a process obtained from a life cycle database.
- Kilowatt-hours used by a similar process as a stand-in for the studied product’s life cycle.
- Industry-average kilograms of material input into a process.
- Industry-average greenhouse gas (GHG) emissions from a process’s chemical reaction.
- Amount spent on process inputs, either specific to the process or an average for the company/industry.
- Sources of Secondary Data:
- Secondary data can come from external sources like life cycle databases, industry associations, etc.
- It can also be data from another process or activity that the reporting company or its supplier controls. This data can be used as is or adapted to fit the process in the studied product’s life cycle.
- Using Secondary Data as a Proxy:
- Sometimes, a company may not have primary data for a specific process. In such cases, they can use secondary data from a similar process as a stand-in.
- For example, if a company doesn’t have primary data for a steam-generating boiler in the studied product’s life cycle, but it has data for a similar boiler used in another product’s life cycle, it can use that data for the studied product’s boiler process.
7. Assessing data quality
- Multiple Data Types and Classifications:
- When collecting data for greenhouse gas (GHG) emissions during a product’s life cycle, there can be different options for data types and classifications.
- For example, you might have options like direct emissions data, primary or secondary process activity data, and financial activity data for the same process.
- Assessing Data Quality:
- It’s crucial to assess the quality of the available data to choose the most accurate information.
- Data quality should not be based on assumptions (like thinking primary data is always better). Instead, companies need to use specific indicators to evaluate data quality.
- Importance of Assessing Data Quality:
- Assessing data quality is important for several reasons:
- Improving Inventory Quality: It helps identify which data sources are of low quality, allowing companies to collect better data and improve the overall accuracy of their inventory.
- Assisting Assurance Process: External assessors may ask about the quality of the data used in the product inventory.
- Demonstrating to Stakeholders: It helps companies show stakeholders that they are using high-quality data in their product inventory.
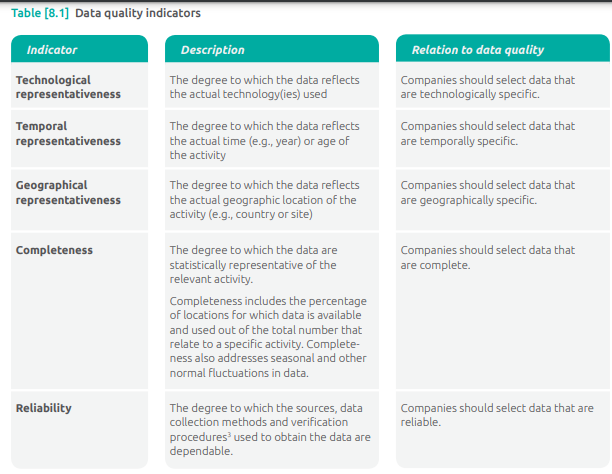
- Data Quality Indicators:
- There are five indicators used to assess data quality for individual data points in the inventory. These indicators consider aspects like time, technology, geography, completeness of data collection, and reliability.
- Methods for Data Quality Assessment:
- There are multiple ways to use these indicators for assessing data quality, including a qualitative approach outlined in the standard.
- Regardless of the method used, companies should document their approach and results in a data management plan. This documentation supports the assurance process, internal quality controls, and tracking improvements in data quality over time.
- Qualitative Data Quality Assessment:
- Qualitative assessment involves assigning scores based on criteria to each data quality indicator.
- The rating system might involve some subjectivity. For example, an old fuel emission factor might be considered of poor quality in terms of time, but it may not be significantly different from a factor less than 6 years old.
- Companies should consider the specific circumstances of the data when using these scores to decide whether to collect new data or when conducting an uncertainty assessment.
- Uncertainty and Data Quality:
- When companies don’t know the uncertainty of individual data points, they can use the data quality indicator scores to estimate the level of uncertainty.

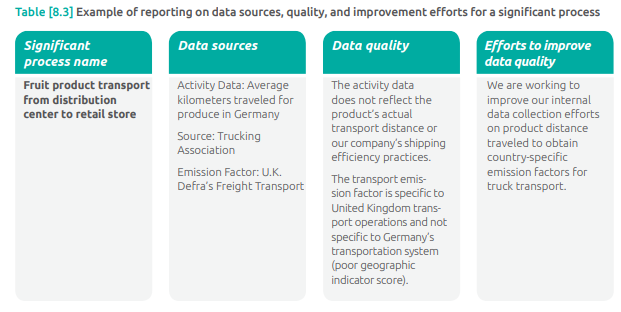
8. Reporting on data quality for significant processes
Companies are required to report on the data sources, data quality, and efforts to improve data quality for significant processes. The criteria included in the screening steps can be helpful to identify significant processes.
9. Additional data quality considerations
- Allocated Data:
- When collecting data, it’s better to have information that doesn’t need allocation.
- Allocation is the process of dividing data between different outputs or products.
- If two sets of data are roughly equal in quality, it’s preferable to use data collected at the process level that doesn’t need allocation. This is better than using facility-level data that requires allocation between different outputs, like various products.
- Data Transparency:
- Companies should have enough information about the data they are using to assess its quality.
- Information needed includes details about how the data was collected, the quality control measures in place, and any assumptions made during the data collection process.
- If there isn’t enough information on these aspects, companies should only use that data if there are no other options of sufficient quality.
- Uncertainty:
- Uncertainty refers to how much doubt or lack of precision there is in the collected data.
- Data with high uncertainty can negatively impact the overall quality of the inventory.
- In simpler terms, if there’s a lot of uncertainty in the data (meaning it’s not very reliable or precise), it can make the entire set of collected data less trustworthy.
10. Data gaps
- Data Gaps:
- Data gaps occur when there’s no primary or secondary data that adequately represents a specific process in the product’s life cycle.
- In most cases, it’s possible to find enough information to make a reasonable estimate, so there should be few, if any, data gaps.
- Proxy Data:
- Proxy data are substitutes for missing information. They come from similar processes and are used as stand-ins for the specific process in question.
- Companies can adjust or customize proxy data to better match the conditions of the studied process if enough information is available.
- Examples of using proxy data include:
- Using data on apples as a proxy for all types of fruit.
- Using data on PET plastic processes when data on the specific plastic input is unknown.
- Adapting an emission factor for one region’s electricity grid to another region with a different mix of power generation.
- Customizing the amount of material consumed by a process from another product’s life cycle to match a similar process in the studied product.
- Estimated Data:
- When proxy data isn’t available, companies can estimate the data for a process to determine its significance.
- If a process is determined to be insignificant based on estimated data, it may be excluded from the final inventory results.
- Criteria for deciding whether a process is insignificant are provided in chapter 7 of the guidelines.
- Documenting Assumptions:
- To assess data quality, any assumptions made while filling data gaps should be documented.
- This documentation should also include an explanation of how these assumptions might affect the final results of the product inventory.
11. Improving data quality
- Iterative Process for Data Quality Improvement:
- Collecting data and ensuring its quality is an ongoing process aimed at improving the overall accuracy of the product inventory.
- If certain data sources are identified as low quality using specific indicators, companies should go through a series of steps to enhance the data.
- Steps for Improving Data Quality:
- Step 1: Identify Low-Quality Data Sources
Use data quality assessment results to identify sources of low-quality data in the product inventory.
- Step 2: Collect New Data
Collect new data for the identified low-quality sources, prioritizing those that are also considered significant through the screening process.2
- Step 3: Evaluate New Data
Assess the quality of the newly collected data. If it’s of higher quality than the original data, replace it. If not, decide whether to use the existing data or collect new data.
- Step 4: Repeat as Necessary
If needed and as resources allow, repeat the process. Identify new low-quality data sources, collect new data, evaluate it, and make replacements if necessary.
- Considerations for Data Source Changes:
If companies decide to change data sources in subsequent inventories, they should evaluate whether this change necessitates an update to the base inventory.

