Introduction
When you’re trying to figure out how much a product contributes to pollution, gathering the right information can be hard and might take a lot of time. But it’s super important because if your data is wrong, your understanding of the product’s impact on the environment will be off. This post and its part 2 gives you the rules and tips to collect the right data and make sure it’s good quality.
Requirements
- Companies shall collect data for all processes included in the inventory boundary.
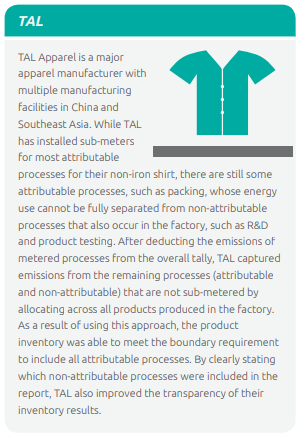
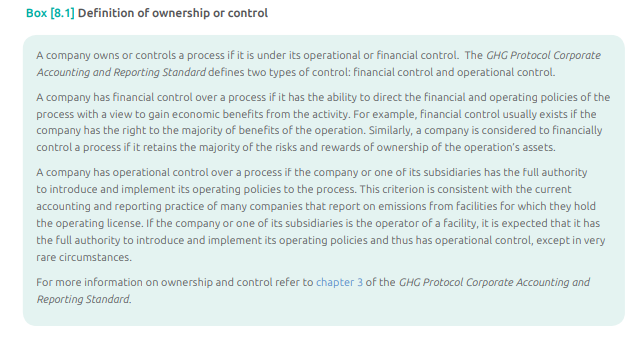
- Companies shall collect primary data for all processes under their ownership or control.
- During the data collection process, companies shall assess the data quality of activity data, emission factors, and/or direct emissions data by using the data quality indicators.
- For significant processes, companies shall report a descriptive statement on the data sources, the data quality, and any efforts taken to improve data quality.
1. Collecting Data for All Processes:
- What it means: Companies should gather information for every step involved in the product’s impact on the environment.
- Example: If you’re looking at the environmental effects of a car, you need data on everything from manufacturing to usage and disposal.
- Primary Data for Owned or Controlled Processes:
- What it means: Companies should get data directly from the processes they own or control.
- Example: If a company owns a factory, it should collect data on emissions directly from that factory.
- Primary Data Definition:
- What it means: Primary data is information collected specifically from the processes in the product’s lifecycle.
- Example: If you want to know how much a factory pollutes, you need data directly from that factory, not just an average from similar factories.
- Not Using Finished Product Mass as Primary Data:
- What it means: You can’t use the overall weight of the finished product as data for the pollution caused during manufacturing.
- Example: If you’re measuring emissions from making bicycles, you can’t just use the total weight of all the bicycles as your pollution data.
- Allocated Data as Primary Data:
- What it means: Data that is divided among different parts of a process is considered primary if it meets other requirements.
- Example: If a factory produces both bicycles and skateboards, and you allocate the pollution data to each product, that data is still primary.
- Data Quality Assessment:
- What it means: Checking how good and reliable the collected data is.
- Example: If you measured how much a factory pollutes, you need to make sure your measurements are accurate and dependable.
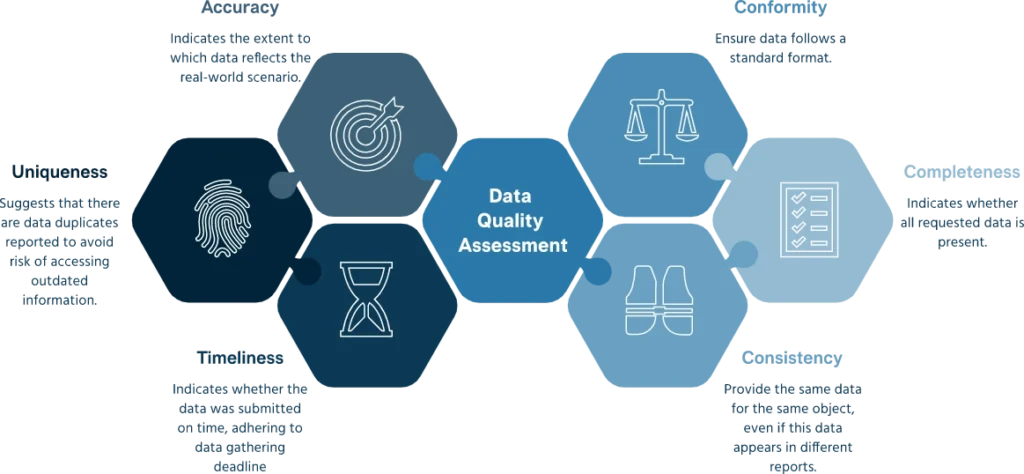
- Data Quality Indicators:
- What it means: Criteria used to evaluate how good the data is.
- Example: Factors like whether the data represents the actual technology used, the geographic location of the processes, the time of the data, how complete it is, and how reliable the sources are.
- The standard defines five data quality indicators to use in assessing data quality. They are:
- Technological representativeness: the degree to which the data reflect the actual technology(ies) used in the process
- Geographical representativeness: the degree to which the data reflects actual geographic location of the processes within the inventory boundary (e.g., country or site)
- Temporal representativeness: the degree to which the data reflect the actual time (e.g., year) or age of the process
- Completeness: the degree to which the data are statistically representative of the process sites
- Reliability: the degree to which the sources, data collection methods, and verification procedures used to obtain the data are dependable.
- Assessing Data Quality During Collection:
- What it means: Checking data quality while you’re collecting it, not after.
- Example: If you notice a problem with the data quality early on, you can fix it right away rather than after you’ve already gathered all the information.
- Reporting for Significant Processes:
- What it means: For important steps in the product’s life cycle, companies should give detailed information about where their data comes from, how good it is, and what they’re doing to make it better.
- Example: If a specific part of making a product contributes a lot to pollution, the company needs to explain where they got their pollution data, how accurate it is, and if they are working to make it more precise.
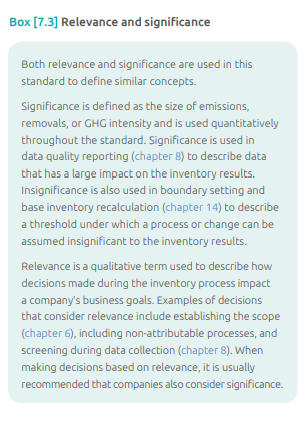
- Identifying Significant Processes:
- What it means: Figuring out which steps in the product’s life cycle have a big impact.
- Example: If the process of painting cars releases a lot of pollution compared to other steps, it’s considered significant.
- Criteria for Identifying Significant Processes:
- What it means: Guidelines for deciding which processes are important.
- Example: If a process contributes a large amount of greenhouse gas emissions compared to the entire lifecycle, it’s considered significant.
1. Identifying attributable processes in the use and end-of-life stages
This explains how companies deal with challenges in understanding and measuring the environmental impact of a product during its use and disposal stages. Here’s a detailed breakdown:
- Assumptions in Process Mapping:
- What happens: When creating a process map, companies often have to make assumptions about the specific processes involved in creating, distributing, and selling their product.
- Why: This is because the exact details of how a product is used can vary a lot between users, making it challenging for companies to pinpoint the exact processes during the use stage.
- Difficulty in Determining Use Stage Processes
- Corporate Activities as Relevant Processes:
- What happens: Corporate activities, which are non-attributable processes, might also be seen as relevant in some cases.
- Why: If a company identifies its own activities as having a substantial impact and sees potential for significant reduction, it might choose to include these non-attributable processes in the assessment.

2. Time period
This explains how the total time period for assessing the environmental impact of a product is influenced by its use and what happens at the end of its life.
- Use-Stage Time Period:
- What happens: The time period for assessing the environmental impact during the use stage is determined by how long the product is expected to provide its service.
- Example: If a laptop is designed to function for 5,000 computing hours, eight hours a day, five days a week, the use-stage time period would be 2.4 years.
- End-of-Life Time Period:
- What happens: The time period for the end-of-life stage is based on how the product is disposed of and how long it takes for the product’s carbon to return to nature.
- Example: Waste treatment methods vary, and waste that is incinerated has a much shorter time period compared to waste that is disposed of in a landfill. The time period also depends on when the carbon in the product returns to the atmosphere.
- Variation in End-of-Life Time Period:
- What happens: The end-of-life time period can vary significantly based on the assumed waste treatment and the geographic location.
- Example: Waste incineration has a shorter time period compared to landfill disposal. Some waste treatment methods may not release all the carbon into the atmosphere. For instance, lignin, a component of wood, does not degrade under certain conditions.
- Disclosure and Justification:
- What happens: When a company knows that not all of a product’s carbon returns to the atmosphere during waste treatment, it is required to disclose and justify this in the inventory report.
- Example: If a material in the product, like lignin in wood, doesn’t release carbon during waste treatment, the company must explain this in the report.
- Carbon Storage Clarification:
- What happens: The passage emphasizes that a company cannot assume that carbon is stored in a product simply by shortening the end-of-life time period. Carbon storage must be known and justified.
- Example: A company can’t assign a short end-of-life time period to a product that actually degrades over a longer period. It needs to be certain that the carbon is stored indefinitely due to waste treatment.
3. Cradle-to-gate inventories
This explains how companies handle the assessment of environmental impact for intermediate products – products that are used to make other final products. There are two scenarios to consider:
- Known Use Profiles:
- What happens: If the company making the intermediate product knows exactly how the final product will be used, they should conduct a complete life cycle assessment (cradle-to-grave) for the intermediate product. This means considering all stages, including distribution, retail, use, and end-of-life.
- Advantage: This approach provides more opportunities for reducing environmental impact and offers stakeholders a complete understanding of the intermediate product’s life cycle.
- Collaboration: Companies might collaborate with the producer of the final product, leveraging their expertise and data for a more accurate assessment.
- Unknown Use Profiles:
- What happens: If the use profile of the final product is unknown, the company making the intermediate product may choose to perform a cradle-to-grave inventory by assuming a representative or average use profile. Alternatively, they may opt for a cradle-to-gate inventory.
- Transparency Requirement: Transparency is crucial, especially if downstream customers of the intermediate product want to use the data for a cradle-to-grave inventory of their final product. The company must clearly disclose and justify the use of a cradle-to-gate boundary, explaining why the full life cycle isn’t considered.
- Preserving Continuity: A cradle-to-gate inventory, as per the standard, does not include the use and end-of-life stages of the final product. This is to maintain the continuous nature of the life cycle approach and prevent selective reporting that excludes GHG-intensive stages while including less impactful stages.
- Additional End-of-Life Information:
- What happens: Even in a cradle-to-gate inventory, the company producing the intermediate product may have useful information about end-of-life processes, such as recycling rates or time periods.
- Inclusion in Report: While this information can be included in the report, it must be clearly separated from the main inventory results and the process map.