Guidance
1. Choosing an appropriate allocation method
Imagine you’re dealing with a process that generates some kind of output, like a factory producing goods or a system creating products. This standard provides six different ways to handle the environmental impact (emissions) of this process. These methods are designed for various situations.
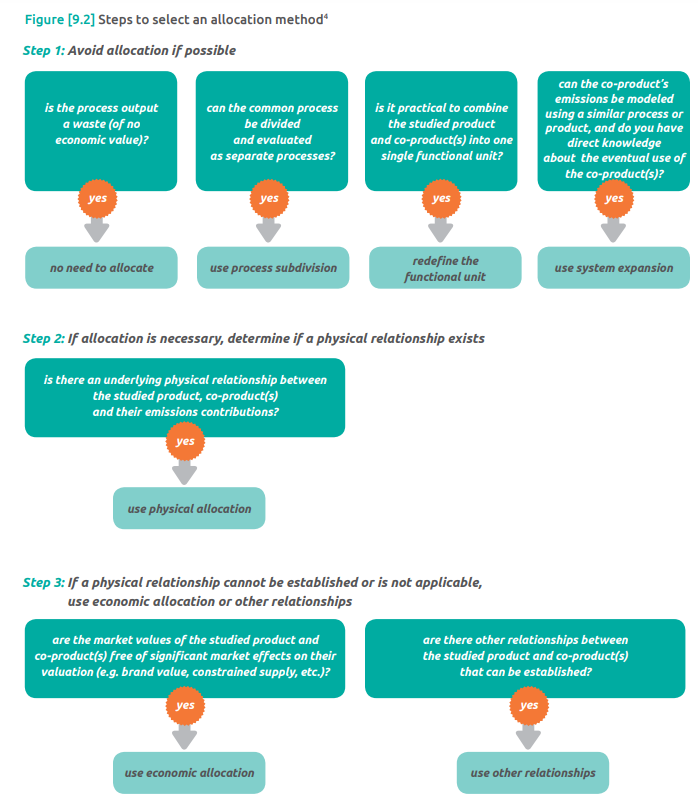
Now, look at Figure 9.2, which is like a guide to help you choose the best way to deal with emissions based on your specific scenario. If the output of your process is considered waste, meaning it has no value and is not used for anything else, then you don’t need to worry about dividing up the emissions. All the emissions are simply attributed to the main product being studied, and any treatment of the waste is also considered part of the process.
However, if the waste from your process is actually used for something else (maybe it has some economic value), then it’s not really “waste” anymore. In this case, you need to think about how to allocate or distribute the emissions because that byproduct is now useful.
2. Avoiding allocation
- Process Subdivision:
- Definition: Process subdivision is a method used to avoid allocation when it’s possible to divide a common process into two or more distinct processes.
- How: This can be done by either sub-metering specific process lines (measuring each part separately) or using engineering models to simulate the process inputs and outputs.
- Objective: The main aim is to separate the common process into sub-processes that individually produce the main product being studied and any co-products. This subdivision is done up to the point where the studied product and its function are isolated.
- Limitation: It’s important not to subdivide the process to the extent that each co-product has a unique and distinct process. Subdivision may not always be possible for all common processes, especially when there’s a physical, chemical, or biological separation of the material input.
- Example: Consider a petroleum refinery producing various outputs like gasoline, diesel fuel, heavy oil, etc. If we’re studying diesel fuel, the refinery process should be subdivided as much as possible to isolate the processes related to diesel fuel. However, complete subdivision might not be possible because diesel fuel comes from one material input (crude oil) that is chemically separated into many products.
Redefining the Unit of Analysis:
- Method: Another way to avoid allocation is to redefine the unit of analysis to include the functions of both the studied product and the co-product.
- Example: If a company produces PET bottles for beverages, and the initial unit of analysis only included processes related to the bottle, but many processes affect both the bottle and the beverage, the company might redefine the unit of analysis to include the function of the beverage. This redefined functional unit might be one bottle containing one liter of beverage consumed.
- System Expansion:
- Method: System expansion involves estimating the emissions and removals contribution of co-products to a common process by substituting the emissions and removals of a similar or equivalent product.
- Consequential Approach: Some consider system expansion as a consequential approach to allocation.
- Criteria for Use: This method requires knowing the exact use of the co-product and collecting quality supplier-specific and/or average emission factor data.
- Example: In a pulp mill, wood is converted into pulp and black liquor. Black liquor can be used for internal power generation or sold as excess power. System expansion can help allocate emissions, for example, by determining the emissions associated with electricity generated using black liquor.
Note: It’s crucial to disclose and justify the chosen allocation methods, especially for system expansion, by explaining why the selected substitute is a reasonable replacement for the co-product. If unsure, exploring other methods is recommended.
3. Performing allocation
- Physical Allocation:
- Definition: Physical allocation is a method used to assign environmental impacts (like emissions and removals) from a common process to the studied product and co-products based on physical relationships.
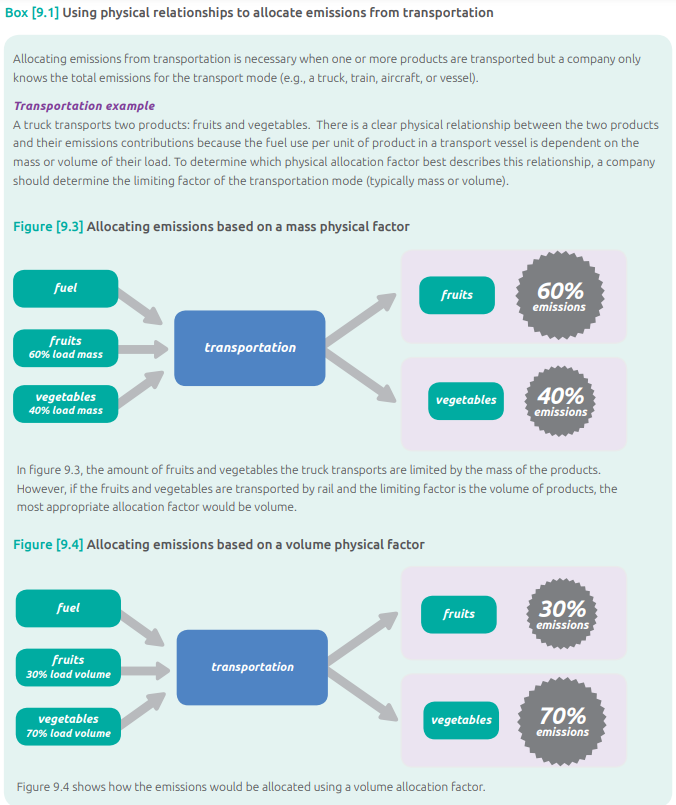
- Example: If the mass of the outputs from a process determines the environmental impact, then the allocation factor could be the mass of co-product outputs, the volume of cargo transported, the energy content of heat and electricity co-products, the number of units produced, the protein content of food co-products, or the chemical composition.
- Objective: The aim is to choose a factor that best reflects the actual physical connection between the products and the environmental impact.
- Economic Allocation:
- Method: Economic allocation involves dividing emissions from a common process to the studied product and co-products based on their economic values.
- Criteria: When choosing an economic allocation factor, companies should use the price of the co-product right after it leaves the common process. If this direct price isn’t available, market prices or prices at a later stage in the product’s life cycle can be used, but downstream costs should be subtracted as much as possible.
- Definition: The economic value is essentially the market value of the product in a commercial market.
- Other Relationships Allocation:
- Method: When neither physical nor economic allocation is suitable, the “other relationships” method is used. This method relies on established industry norms, conventions, or academic sources for allocating emissions.
- Assumptions: If there are no established norms, a company can make assumptions about the common process to choose an allocation method. However, when making assumptions, it’s important to assess the uncertainty of the scenario and understand how these assumptions might affect the results.
4. Choosing between physical and economic allocation
- Step 3 in Figure 9.2: Deciding Between Physical and Economic Allocation: In Figure 9.2, Step 3 suggests that when you can’t establish a physical relationship between the main product, co-products, and the emissions of a process, you should consider using economic or other relationships. Physical relationships might not be possible under certain conditions:
- No Data Availability: If there’s no data on how the products and emissions are physically related, especially if the process is operated by a supplier with proprietary information.
- Multiple Co-Products: When there are several co-products, and no single physical allocation factor is applicable because some outputs are measured in energy terms, while others are in volume or mass.
- Determining When to Use Physical or Economic Allocation:
A. Physical Allocation (Preferred when):
- Establishable Relationship: If you can establish a clear physical relationship between the main product and co-products that accurately reflects their emissions contributions.
- Correlation with Output Change: When changes in the physical output of products (like producing more co-products) correlate with changes in the process’s emissions.
- Brand Influence Irrelevant: When the market value of co-products is strongly influenced by the brand but doesn’t reflect their relative emissions contributions.
Economic Allocation (Preferred when):
- Physical Relationship Not Possible: When a physical relationship can’t be established.
- Market Demand Influence: If co-products wouldn’t be produced without market demand for the main product and/or other valuable co-products (e.g., by-catch in lobster harvesting).
- Waste Becomes Valuable: When co-products were initially waste but gain value in the market as a replacement for another material input (e.g., using fly ash in cement production).
- Physical Relationship Not Representative: When the physical relationship doesn’t accurately reflect the relative contributions to emissions.
Example: Consider the process of catching lobsters where additional fish are caught by accident and sold as by-catch. By-catch is less valuable than lobsters, but it can make up a significant part of the total output. In this case:
Preference for Economic Allocation: Economic allocation is preferred because the by-catch might not be caught in the same way if lobsters weren’t being caught, and changes in the amount of by-catch and lobsters don’t necessarily correlate with changes in emissions using the same amount of fuel.
5. Comparing allocation results
- When Allocation Methods Are Unclear:
Perform Multiple Allocations:
- Why: When it’s not clear which allocation method is the best fit, companies should try different methods and see how they compare.
- Importance: This is particularly crucial when deciding between physical, economic, or other allocation methods.
Compare Results:
- Why: After performing multiple allocations, compare the results obtained from each method.
- Objective: The goal is to see if the different methods give similar results or if they lead to variations.
- Decision-Making Criteria:
Case 1: Similar Results:
- What If Similar Results: If the methods produce similar outcomes, it means the choice between them won’t significantly impact the final inventory results.
- Reporting: Companies should mention this in their inventory report to communicate that the specific method chosen doesn’t alter the overall findings.
Case 2: Different Results:
- What If Different Results: If the allocation methods result in different greenhouse gas (GHG) emissions.
- Decision-Making: Choose the allocation method that is more conservative. In simpler terms, go with the method that assigns more emissions to the studied product rather than the co-products.
- Disclosure and Justification:
Required Reporting:
- What to Disclose: Companies must disclose and justify the methods they used to either avoid allocation or perform allocation.
- Why Important: This transparency helps others understand the reasoning behind the chosen method.
Range of Results:
- Additional Reporting: As part of the qualitative uncertainty description in the inventory report, companies may also report a range of results.
- Why Include Range: This provides a broader perspective on the potential variations in emissions based on different allocation methods.
6. Methods for allocation due to recycling
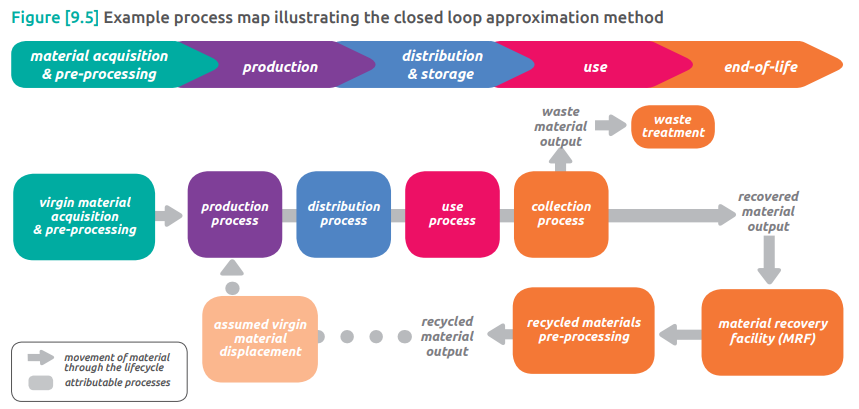
- Closed Loop Approximation Method:
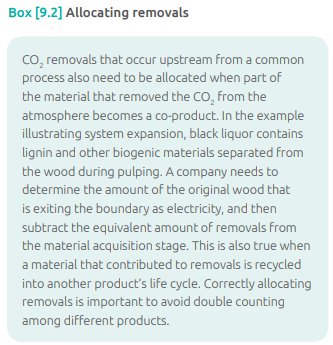
- Purpose: Accounts for how recycling impacts the net acquisition of a material.
- Origin: Known by different names like the 0/100 method, end-of-life approach, recyclability substitution approach, and closed loop method in certain standards.
- Assumption: Assumes that recycled material can replace virgin material without changing the product’s life cycle, meaning they have similar properties.
- Process: Involves processes like sorting, shredding, cleaning, melting, and deinking to convert recovered material into a recycled material ready for use.
- Purpose: Accounts for how recycling impacts the net acquisition of a material.
- Allocation Principle: No emissions or removals from recycling are assigned to another product system. Instead, the creation of recyclable material displaces virgin material and its associated emissions.
- Calculation Steps: Calculate impacts for virgin material acquisition and preprocessing, end-of-life stage (including recycling), and the virgin material displacement factor (recycling rate multiplied by the attributable processes for virgin material acquisition and preprocessing).
- Consideration for Multiple Inputs: If a product has multiple material inputs, only the processes related to the displaced material are considered.
- Avoiding Double Accounting: To avoid double accounting, assume all material input is virgin when calculating impacts for virgin material acquisition and preprocessing.
- Alternative Approach: The recycled content approach can be used for recycled input, with the closed loop approach applied to the remaining net material output.
- Application Scope: Can be applied not only to end-of-life situations but also to recycling within a life cycle stage (e.g., creation and reuse of scrap during production).
- Application Scope: Can be applied not only to end-of-life situations but also to recycling within a life cycle stage (e.g., creation and reuse of scrap during production).
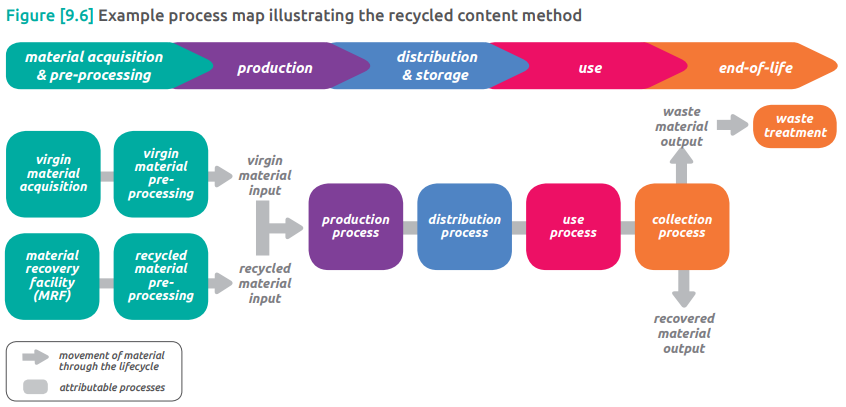
- Recycled Content Method:
- Allocation of Emissions:
- Allocation Principle: Allocates recycling process emissions and removals to the life cycle that uses the recycled material.
- Names: Also known as the cut-off method or the 100-0 method.
- Calculation Steps: Calculate impacts for material acquisition and preprocessing stages (including both virgin and recycled material), and end-of-life stage (treatment of waste material).
- Benefits Illustration: While not including a virgin material displacement factor, it shows potential benefits of recycling in the product’s inventory, such as reducing waste in waste treatment and upstream virgin material acquisition.
- Consideration of Impact Categories: Companies are encouraged to consider all environmental metrics before making decisions, as focusing on one impact category (e.g., GHG emissions) might lead to decisions unfavorable to other categories (e.g., material depletion).
7. Choosing between closed loop approximation and the recycled content method
- Recycled Content Method:
When to Use: - If the product contains recycled input but no recycling happens downstream.
- When the market for recycled material is saturated (supply exceeds demand), and creating more recycled material may not reduce the use of virgin material.
- When the company directly controls the amount of recycled material input and can use it as a reduction mechanism.
- In cases where the product’s use stage duration is long and/or highly uncertain, leading to uncertainty in the amount of material recycled at the end-of-life.
- Closed Loop Approximation Method:
When to Use:
- If the recycled content of the product is unknown because recycled material is indistinguishable from virgin material in the market.
- When the market for recycled material is not saturated (demand exceeds supply), and creating more recycled material is likely to increase its usage.
- In situations where the product’s use stage duration is short and/or well known.
- When Neither Method Seems Appropriate:
- Consider Sector Guidance: Refer to sector-specific guidance, product rules, technical reports, journal articles, or other standards for specified methods. For example, the American Forest and Paper Association recommends the “number of subsequent uses” method for recycling cellulosic fiber in paper products.
- Economic Allocation or Other Methods: In some cases, economic allocation or other methods may be more appropriate for a specific product’s inventory.
- Detail the Chosen Method: If a unique method is used, provide details in the inventory report or as a supplementary document. External verification is encouraged to ensure conformance with standards.
- Uncertain Situations: If it’s not obvious which method is best, conduct a scenario uncertainty assessment (e.g., sensitivity analysis) on potential methods.


8. Collecting recycling data
- Attributional Approach:
- Definition: In line with the attributional approach of the standard.
- Essence: The approach that looks at the environmental impact of a product throughout its life cycle.
Data for Recycled Material Output:
- Data Source: The data used to determine the amount of recycled material output should come from specific recycling data of a product or average recycling data for the product in the geographic location where it’s used (defined by the use profile).
- Quality Requirements: Data collection and quality follow the guidelines provided in Collecting Data and Assessing Data Quality blog.
- Closed Loop Approximation Method:
- Consideration for Data: Companies using the closed loop approximation method need to ensure that data used to determine recycled material output excludes material where inherent properties have changed.
- Consideration for Data: Companies using the closed loop approximation method need to ensure that data used to determine recycled material output excludes material where inherent properties have changed.
- Handling Aggregated Data:
- Situation: If only aggregated data is available and it’s known that some inherent property change occurs in recycled material, companies should assume a percentage of property loss based on other available data.
- Examples: This loss could be indicated by a reduction in economic value or a percentage loss of material property like elasticity.
- Data Quality Limitation:
- Transparency: If it’s not possible to break down the data, but there’s awareness that some material properties change, it should be clearly stated as a data quality limitation in the inventory report.

