Imagine you’re trying to figure out how much your company is affecting the environment by looking at all the things you buy, use, and produce. This is what we call a “scope 3 inventory.”
But, there’s a problem. It’s not always easy to be 100% certain about these measurements. There are lots of things that can make the numbers a bit uncertain, like not having perfect data or not being able to predict everything accurately.
So, an “uncertainty assessment” is like a plan to figure out what might make the numbers uncertain and how uncertain they might be. It’s a way to say, “We’re not entirely sure about these numbers, but we’re going to do our best to understand why they might not be perfect.”
Identifying and writing down these sources of uncertainty can be super helpful. It’s like keeping a list of things that might make your measurements less accurate. Once you know what these things are, you can work on making your measurements better and more reliable.
Because lots of different people will read your report, it’s essential to be clear about what you’re not entirely sure about. You want them to know that you’re aware of any uncertainties and that you’re working to make your numbers as good as they can be. It’s like saying, “We’re honest about what we’re not certain about, and we’re doing our best to improve.”
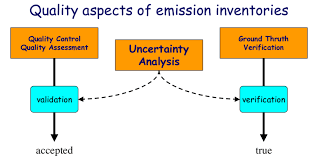
Guide to the uncertainty assessment process
Uncertainty assessment helps in two ways:
Improving Data Quality: It’s a tool to make your measurements better. You figure out what could make the numbers uncertain, like missing data or errors, and then work to fix them. It’s like cleaning up your measurements to make them more accurate.
Reporting Uncertainty: When you share your environmental impact with others, you need to tell them if there’s some uncertainty in the numbers. It’s like saying, “We did our best, but here are the things we’re not entirely sure about.”
To do this well, you should keep an eye on these uncertainty sources all the time while you’re collecting data. It’s like making sure you’re constantly improving your measurements.
There are two ways to deal with uncertainty:
Qualitative: This means you describe uncertainty in words. For example, you might say, “We’re not very sure about this because the data was incomplete.”
Quantitative: This is a more detailed way. You put numbers on how uncertain things are. It’s like saying, “This measurement might be off by about 5%.”
Quantitative is usually better because it gives a clearer picture, and it helps you focus on the things that make your measurements really uncertain.
And when you share your findings, make sure you tell everyone about the uncertainties. It’s about being honest and transparent. You can also talk about what you’ll do to make your measurements better in the future.
Overview of uncertainty types
Uncertainty is divided into three categories: parameter uncertainty, scenario uncertainty and model uncertainty. The categories are not mutually exclusive, but they can be evaluated and reported in different ways.
These categories aren’t separate; they can overlap. Imagine you’re baking a cake. Parameter uncertainty is like not being entirely sure about the exact amount of sugar you need. Scenario uncertainty is not knowing if you’ll have all the ingredients on hand when you bake. Model uncertainty is like having a recipe that might not be entirely accurate.
1. Parameter uncertainty
This is all about how sure we are that the numbers we use in our environmental measurements are absolutely accurate. Imagine you’re trying to measure how much carbon dioxide (CO2) is produced to make a toner cartridge. The number you use might not be perfect because it’s based on some data that’s not 100% certain. Parameter uncertainty is like saying, “We’re not entirely sure about the number we’re using in our measurements because it might not be exact.”
Single Parameter Uncertainty: Sometimes, the uncertainty is about just one number we use. This could be data about how much CO2 is produced or how certain processes work. For example, the number we use might be from a different time or place, so it’s not a perfect fit for our situation.
Single parameter uncertainty can happen with three types of data:
- Direct Emissions Data: This is data about the pollution coming directly from your company.
- Activity Data: This is information about the activities your company does that affect the environment.
- Emission Factors: These are numbers that tell us how much pollution certain activities produce.
For instance, if we have an emission factor that says 4.5 kg of CO2 is produced to make 1 kg of plastic for toner cartridges, it might not be exactly right. The data could be based on a small sample of plastic makers, or it might be from a different time or place. This creates parameter uncertainty.
Quantifying Parameter Uncertainty: We can try to figure out how uncertain our data is by using things like measurement errors, data quality indicators, and probability distributions. It’s like trying to put a number on how unsure we are about the number we’re using in our measurements.
Propagated Parameter Uncertainty: This is like when all these uncertainties add up. It’s how they affect our final result. We can use methods like random sampling (Monte Carlo method) or analytical formulas (Taylor Series expansion method) to figure out the combined effect of all these uncertainties.
Example: Let’s say a company calculates its CO2 emissions from business travel to be 155,000 metric tons. But, the data it used for activities, emission factors, and other stuff all have some uncertainty. When we add up all this uncertainty, we find that there’s a 95% chance that the actual emissions from business travel could be between 140,000 and 170,000 metric tons. So, our number might not be 155,000 exactly; it could be plus or minus 15,000 metric tons.
2. Scenario uncertainty
Scenario uncertainty about the choices we make when we’re doing our measurements. It’s like trying to figure out how different choices might lead to different results.
- Multiple Choices: Sometimes, when we’re trying to measure things like how much pollution a company creates, there are different ways to do it. For example, you could choose one way to divide up the pollution between different parts of the company, or you could choose a different way.
- Using Standards: We often use rules or standards to make sure our choices are fair and consistent. Standards help us reduce uncertainty because they tell us how to make these choices in a standardized way.
- Methodological Choices: These are the choices we make when doing our measurements. They can include things like how to divide up electricity use between different parts of the company, how long a product is used, or what happens to it at the end of its life.
- Scenario Analysis: To understand how these choices affect our measurements, we do something called “scenario analysis.” It’s like trying out different options to see how they change the results. This helps us see how our choices create different outcomes.
Example: Imagine a company wants to know how much electricity is used to make toner cartridges. They can do this in two ways: by looking at how many units of toner are produced (physical allocation) or by looking at the economic value (economic allocation). The physical allocation says 30% of the electricity is used for toner, while the economic allocation says 40%. These are two different choices, and they might lead to different results.
3. Model uncertainty
This happens when we use computer models or mathematical equations to understand how things work in the real world. These models can’t be perfect because the real world is super complex. So, there are always some mistakes or uncertainties when we use models.
Simplifying Reality: When we use a model, we’re kind of simplifying the real world into numbers and equations. This simplification is necessary, but it means we might not get everything exactly right.
Parameter and Scenario Approaches: We talked about these earlier. Sometimes, model uncertainties are a bit like parameter or scenario uncertainties. We can think of them in a similar way.
Hard-to-Quantify Uncertainty: But here’s the tricky part: some things about how our models work can be really hard to understand and put into numbers. It’s like trying to explain a magic trick. These kinds of uncertainties are tough to measure and describe.
Example 1: Imagine we’re trying to figure out how materials get to a factory that makes toner cartridges. We use a computer model to predict how they’re transported, like which roads they take and how fast they go. But this model isn’t perfect because it can’t predict every little detail about the real world. So, there’s some uncertainty about how the materials are actually transported.
Example 2: Let’s say we’re predicting the emissions from making soy-based ink for the toner cartridges. We use a model to do this, but it’s like a simplified version of how soy production and fertilizers work. The real world is way more complicated. So, the model might not get the emissions exactly right, and there’s uncertainty about how much N2O gas is produced.
Reporting uncertainty
When we’re not entirely sure about the measurements we’ve made or the data we’ve used, we call this uncertainty. We need to tell others about this uncertainty when we share our findings.
- Different Ways to Report: There are various ways to explain this uncertainty. One way is to use words to describe where the uncertainty comes from. We can say things like, “We’re not very sure about this number because the data was collected in different places.” Another way is to use numbers and charts to show how unsure we are. For example, we can draw error bars or histograms that illustrate the range of uncertainty.
- More Information is Better: It’s a good idea to provide as much detail as possible about the uncertainty. When people use the information you’ve shared, they can look at this uncertainty data and decide for themselves how much they trust the information. The more information you give, the better they can understand the potential errors in the data.