A Quantitative and Systematic Environmental Evaluation
Abstract — What This Study Really Tells Us
As sustainability becomes central to packaging innovation, Life Cycle Assessment (LCA) has emerged as one of the most powerful tools to measure environmental impact. This study conducts a meta-analysis of 14 LCA research papers (2010–2022) focused on polyethylene terephthalate (PET) water bottles, aiming to produce statistically harmonized and comparable results.
Instead of narratively summarizing studies, the researchers:
-
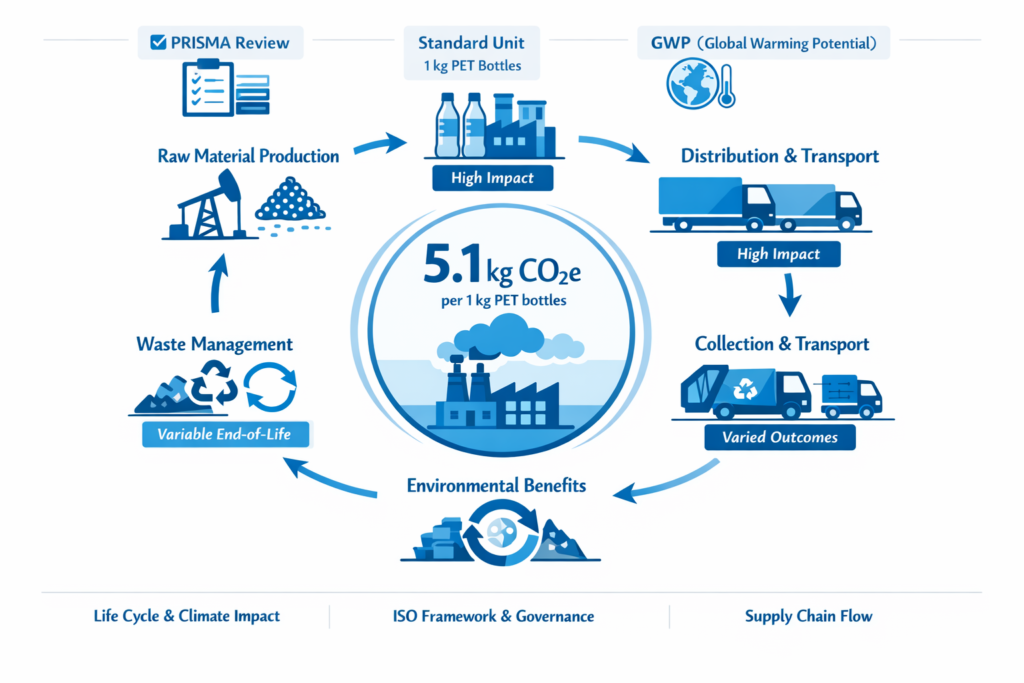
Followed PRISMA systematic review guidelines
-
Standardized all studies to a common functional unit (1 kg of PET bottles)
-
Focused on Global Warming Potential (GWP) as the primary impact indicator
-
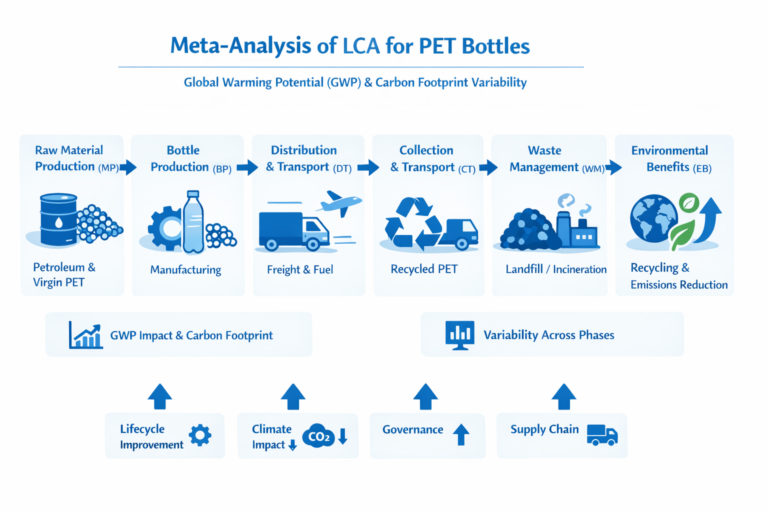
Divided the life cycle into six structured phases:
-
Raw Material Production (MP)
-
Bottle Production (BP)
-
Distribution & Transportation (DT)
-
Collection & Transport (CT)
-
Waste Management (WM)
-
Environmental Benefits (EB)
-
Key Finding
The harmonized result shows an average emission of 5.1 kg CO₂-equivalent per 1 kg of PET bottles.
Major Impact Contributors
-
Raw material production
-
Bottle manufacturing
-
Distribution & transportation
Interestingly:
-
Manufacturing stages showed low variability (because processes are relatively standardized globally).
-
End-of-life stages showed high variability, mainly due to differences in recycling rates, collection systems, and waste treatment scenarios.
The study further validated its approach by comparing results with Korean Environmental Product Declaration (EPD) data, confirming its practical reliability.
Most importantly, this meta-analytical framework can be applied beyond PET bottles — to any product category — making it highly valuable for evidence-based sustainable product development.
1. Introduction
Why PET Bottles Matter More Than Ever
The growth of:
-
E-commerce
-
Urbanization
-
Rising purchasing power
-
Expanding global population
has dramatically increased packaging waste.
Example:
If you order bottled water online, the environmental burden includes:
-
Plastic bottle production
-
Cap and label manufacturing
-
Secondary packaging
-
Long-distance transport
-
Disposal or recycling
Multiply this by billions of bottles consumed annually, and the scale becomes enormous.
PET water bottles are particularly important because:
-
They dominate the bottled beverage market
-
They represent one of the fastest-growing plastic segments globally
-
They contribute significantly to plastic waste streams
What is Life Cycle Assessment (LCA)?
LCA is often called a “cradle-to-grave” approach.
It evaluates environmental impacts from:
-
Raw material extraction
-
Manufacturing
-
Distribution
-
Use phase
-
End-of-life disposal or recycling
The methodology is standardized under:
-
ISO 14040:2006
-
ISO 14044:2006
These standards ensure:
-
Clear goal and scope definition
-
Defined functional unit
-
Transparent system boundaries
-
Consistent impact assessment methods
Example:
If two researchers assess a 1-liter PET bottle:
-
One may use a European electricity grid dataset.
-
Another may use a coal-heavy Asian grid.
-
One may assume 80% recycling.
-
Another may assume landfill disposal.
The results will differ significantly.
This is where the problem begins.
The Core Problem: Incomparability in LCA Studies
Even when evaluating the same product (a PET bottle), results vary because of:
-
Different functional units (per bottle vs per kg vs per liter of water delivered)
-
Different system boundaries
-
Different databases (e.g., Ecoinvent vs regional data)
-
Different recycling assumptions
-
Different impact assessment methods
Example:
Study A: 2.8 kg CO₂ per 1,000 bottles
Study B: 4.3 kg CO₂ per 1,000 bottles
Without harmonization, we cannot tell:
-
Which one is “correct”
-
Whether differences are methodological or real
This variability limits decision-making.
Why Previous Reviews Were Not Enough
Earlier LCA reviews were largely narrative:
-
Some compared reusable vs single-use bottles.
-
Some compared PET vs glass vs aluminum.
-
Some evaluated bio-plastics vs petrochemical plastics.
But most did not statistically harmonize numerical results.
They explained trends — but did not generate a unified carbon footprint value.
This study addresses that gap.
What is Meta-Analysis — and Why Use It?
Meta-analysis is a statistical method that combines results from multiple independent studies to derive:
-
Average estimates
-
Variability ranges
-
Statistical heterogeneity
-
Confidence intervals
It is widely used in medicine.
Medical Example:
If 15 clinical trials test a new drug:
-
Each gives slightly different results.
-
A meta-analysis pools them to give a more reliable estimate.
Similarly, for PET bottles:
Instead of relying on one LCA study, this approach synthesizes 14 independent studies.
This increases:
-
Reliability
-
Statistical robustness
-
Policy relevance
Why Focus on Global Warming Potential (GWP)?
Among many environmental indicators (acidification, eutrophication, toxicity, etc.), this study focuses on:
-
Global Warming Potential (GWP)
-
Greenhouse Gas emissions (GHG)
Because:
-
Carbon footprint is the most widely understood sustainability metric.
-
It directly links to climate change mitigation.
-
It aligns with corporate net-zero strategies.
Example:
If a company claims:
“We reduced PET bottle carbon footprint by 15%”
That refers directly to GWP.
Why PET Bottled Water?
PET water bottles were selected because:
-
They are widely studied in LCA literature.
-
Consumption is rapidly increasing.
-
Waste management challenges are severe.
-
Recycling infrastructure varies globally.
Real-World Scenarios:
-
In Germany → high recycling rates → lower net GWP.
-
In regions with low recycling → landfill or incineration increases impact.
-
Use of recycled PET (rPET) can significantly reduce emissions.
-
Bio-PET alternatives are emerging but require evaluation.
This makes PET bottles an ideal candidate for systematic comparison.
Structure of the Meta-Analysis
The study breaks the PET bottle life cycle into six phases:
Raw Material Production (MP)
-
Crude oil extraction
-
Polymerization to PET resin
Bottle Production (BP)
-
Preform injection molding
-
Blow molding into final bottle
Distribution & Transportation (DT)
-
Transport of empty bottles
-
Transport of filled bottles to retailers
Collection & Transport (CT)
-
Post-consumer waste collection
-
Transport to recycling or landfill
Waste Management (WM)
-
Recycling
-
Incineration
-
Landfilling
Environmental Benefits (EB)
-
Credit from avoided virgin material (via recycling)
Why This Study is Methodologically Important
Because it:
-
Harmonizes functional units
-
Standardizes GWP values
-
Identifies variability sources
-
Quantifies average impact
-
Compares meta-results with real-world EPD data
It bridges:
Academic research ↔ Industrial application
Statistical synthesis ↔ Practical sustainability metrics
Broader Implications for Sustainable Product Development
This approach enables:
-
Evidence-based carbon benchmarking
-
Policy evaluation
-
Corporate decision-making
-
Standardized reporting
-
Better Product Category Rule development
Example for Industry:
If a beverage company wants to redesign packaging:
-
Should they reduce weight?
-
Increase recycled content?
-
Shift to local production?
-
Improve recycling partnerships?
Meta-analysis provides statistically grounded insights rather than relying on isolated studies.
Why This Matters for Future LCA Practice
By adhering to ISO standards and harmonizing data:
-
Mean GWP values can be calculated.
-
Variation factors can be identified.
-
Typical carbon footprint ranges can be established.
This moves LCA from:
“Case-specific academic exercise”
to
“Strategic decision-making tool”
2. Materials and Methods
Systematic Framework for Conducting the Meta-Analysis
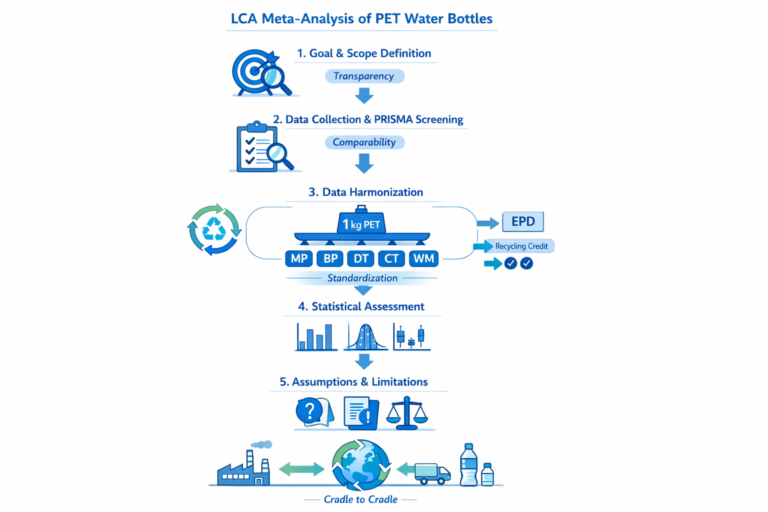
A Structured Five-Step Research Framework
The study follows a sequential five-step methodology, designed to systematically synthesize multiple LCA studies and derive an integrated conclusion.
What makes this approach powerful is that it:
-
Is iterative (data can be updated or refined)
-
Can be applied to both products and services
-
Enhances comparability across studies
-
Improves statistical robustness
Think of it as converting scattered academic findings into a structured, decision-ready dataset.
2.1 Goal and Scope Definition
(Foundation of Any Reliable LCA Meta-Analysis)
Before combining LCA results, a clear target must be defined.
Goal of the Study
To analyze the environmental performance across the entire life cycle of PET bottled water systems, with a particular focus on Global Warming Potential (GWP).
Scope
The system boundary follows a cradle-to-cradle perspective, meaning it includes:
-
Raw material extraction
-
Resin production
-
Bottle manufacturing
-
Distribution
-
Collection
-
Waste treatment
-
Recycling benefits
Unlike cradle-to-grave (which stops at disposal), cradle-to-cradle accounts for recycling credits.
Example:
If 1 kg of PET bottle waste is recycled into new PET resin:
-
Virgin material production is avoided.
-
This “avoided burden” is counted as environmental benefit.
This makes the analysis more aligned with circular economy principles.
2.2 Data Collection and Screening Process
(Ensuring Scientific Rigor and Transparency)
To perform a reliable meta-analysis, the study used a structured literature search strategy.
Data Sources
Studies were collected from:
-
Web of Science database
-
Peer-reviewed journals
-
Project reports
-
Environmental Product Declarations (EPDs)
Search Query Used
The following keywords were applied:
LCA OR life cycle assessment
AND PET OR polyethylene terephthalate
AND bottle OR beverage OR packaging OR water system
AND GWP OR global warming OR GHG OR CO2
(2010–2023)
Only studies:
-
Published after 2010
-
Focused on carbon-related indicators
-
Related to PET bottle systems
were included.
PRISMA-Based Screening
The screening followed PRISMA guidelines, which ensure:
-
Transparency
-
Reproducibility
-
Quality reporting
Why PRISMA Matters
Without structured screening, meta-analysis risks bias.
Example:
If we randomly pick LCA studies, we may unintentionally:
-
Favor European high-recycling cases
-
Exclude developing country landfill scenarios
-
Include review papers instead of quantitative data
PRISMA ensures only relevant, quantitative, comparable studies are included.
Screening Outcome
-
Initial articles identified: 64
-
After exclusion criteria: 14 final studies
Studies were excluded if they:
-
Did not provide phase-wise GWP data
-
Used incompatible system boundaries
-
Were purely literature reviews
-
Did not quantify carbon emissions
This ensured the final dataset was statistically usable.
2.3 Harmonization of Data
(Making Apples Comparable to Apples)
One of the biggest challenges in LCA comparison is harmonization.
Different studies may report:
-
Per bottle
-
Per liter of water
-
Per 1000 bottles
-
Per kg of material
Without conversion, comparison is meaningless.
2.3.1 Categorizing Life Cycle Phases
To standardize results, the PET bottle life cycle was divided into six harmonized phases:
Material Production (MP)
-
Crude oil extraction
-
PET resin polymerization
-
PP label production
-
HDPE cap production
Example:
Producing 1 kg of virgin PET resin typically requires fossil feedstock and energy-intensive polymerization.
Bottle Production (BP)
-
Injection molding of preforms
-
Stretch-blow molding
-
Label printing
-
Cap molding
Example:
Electricity-intensive processes dominate this phase.
Distribution & Transportation (DT)
-
Transport of empty bottles
-
Transport of filled bottles to retailers
Example:
Shipping bottled water 800 km by truck significantly increases GWP compared to local production.
Collection & Transportation (CT)
-
Collection of used bottles
-
Transport to sorting or recovery facilities
Variability example:
-
Germany: well-organized deposit return system
-
Regions with informal collection: lower efficiency
Waste Management (WM)
-
Mechanical recycling
-
Chemical recycling
-
Incineration
-
Landfilling
Example:
-
Mechanical recycling saves emissions.
-
Incineration produces energy recovery.
-
Landfilling produces minimal immediate CO₂ but long-term environmental burdens.
Environmental Benefits (EB)
-
Avoided virgin material production
-
Energy recovery credits
Recycling types:
-
Open loop → PET → fibers
-
Closed loop → PET → new bottle-grade resin
Closed-loop recycling gives higher circular benefit.
2.3.2 Extracting Phase-Wise GWP
Not all studies reported complete phase data.
Some:
-
Provided only total GWP
-
Presented percentage contributions
-
Used graphical representations
Where necessary:
-
Total GWP × phase percentage = phase GWP
-
Bar chart lengths were digitally measured for proportional extraction
This ensures no usable data is lost.
2.3.3 Re-Calculating to a Unified Functional Unit (UFU)
Different functional units (FU) create inconsistency.
Example:
-
Study A: 0.5 L bottle
-
Study B: 1 L bottle
-
Study C: 1000 bottles
To standardize, the researchers defined:
Unified Functional Unit (UFU) = 1 kg of PET bottles
Why weight-based?
Because bottle sizes vary, but material mass is the core environmental driver.
All GWP values were converted to:
kg CO₂-eq per 1 kg PET bottle
This conversion enabled direct statistical comparison.
2.4 Statistical Assessment
(From Data to Insight)
After harmonization, statistical analysis was conducted:
Calculated Metrics:
-
Average (AVG)
-
Standard Deviation (SD)
-
Coefficient of Variation (CV)
Why These Matter:
-
Average → Identifies hotspot phases
-
Standard Deviation → Shows variability
-
Coefficient of Variation (CV) → Reveals uncertainty
Example:
If MP phase has:
-
Low CV → consistent across countries
-
High CV in WM phase → depends heavily on recycling rates
Validation with EPD Data
To test reliability, results were compared with Korean Environmental Product Declaration (EPD) data.
EPDs disclose:
-
Scope
-
Methodology
-
Life cycle emissions
If meta-analysis average ≈ EPD results → methodology is validated.
This bridges academic LCA and real-world product certification.
Statistical Testing of Bottle Sizes
The study used the Games–Howell post hoc test (α = 0.05) via SPSS.
Why?
Because bottle volumes (0.33 L, 0.5 L, 1 L, 2 L) may have unequal variances.
This ensures statistical rigor in volume comparison.
2.5 Assumptions and Limitations
No meta-analysis is perfect. The authors clearly define limitations.
Partial Phase Inclusion
Some studies lacked full life cycle data. Partial results were included to increase sample size.
Broader Inclusion of PET Studies
Studies on PET flakes were included.
Carbonated beverage bottles were excluded due to higher material thickness.
Waste Scenario Ambiguity
Some studies did not clearly define:
-
Recycling rate
-
Incineration percentage
-
Landfill allocation
In such cases, impacts were grouped under “Waste Management”.
Why This Methodology Is Powerful
This approach:
-
Reduces bias
-
Increases comparability
-
Quantifies variability
-
Identifies carbon hotspots
-
Validates results with market data
-
Bridges academic and policy relevance
It transforms fragmented LCA research into actionable sustainability intelligence
3. Results and Discussion
A Descriptive Interpretation of the Meta-Analysis Findings
When multiple Life Cycle Assessment (LCA) studies are brought together under a harmonized framework, patterns begin to emerge that are often invisible in isolated research papers. This meta-analysis does exactly that — it transforms fragmented findings into a coherent environmental narrative of the PET water bottle system.
Rather than simply reporting numbers, this section explains what those numbers mean, why they matter, and how they influence sustainable packaging decisions.
Understanding the Research Landscape
After applying strict PRISMA-based screening criteria, 14 studies published between 2010 and 2022 were selected for analysis. These studies originated from different regions, primarily Europe, and applied varying system boundaries and functional units.
This diversity is important.
For example, a PET bottle assessed in a country with a coal-heavy electricity mix will naturally show higher emissions than one produced in a region dominated by nuclear or renewable energy. Similarly, a country with a well-established deposit-return system will report very different end-of-life impacts compared to one relying heavily on landfill.
By harmonizing these variations, the researchers ensured that comparisons were meaningful rather than misleading.
Overall Carbon Footprint of PET Bottle Systems
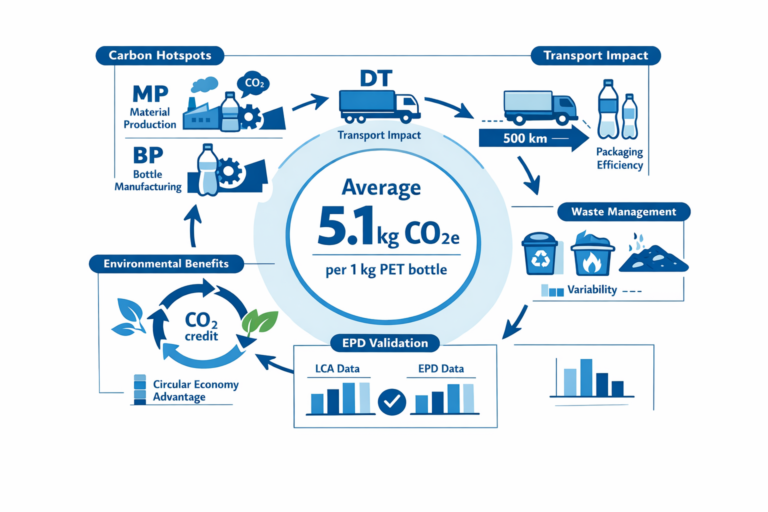
After standardizing all data to a unified functional unit of 1 kg of PET bottle, the average life-cycle Global Warming Potential (GWP) was found to be:
5.093 kg CO₂-equivalent per kg of PET bottle
To put this into perspective:
-
Producing 1 kg of PET bottles emits roughly the same CO₂ as driving a standard gasoline car for approximately 20–25 kilometers.
-
A single 0.5 L bottle (weighing ~20 g) would therefore represent about 0.10 kg CO₂-eq.
This provides a tangible sense of scale for consumers and policymakers.
Material Production: The Dominant Hotspot
Across nearly all studies, the Material Production (MP) phase consistently emerged as the largest contributor to emissions.
This stage includes:
-
Extraction of fossil-based feedstock
-
Production of ethylene glycol and terephthalic acid
-
Polymerization into PET resin
-
Solid-state polymerization to achieve bottle-grade properties
These processes require high temperatures and substantial energy inputs. Since virgin PET is primarily fossil-derived, its carbon intensity is structurally embedded in the raw material stage.
Practical Example
If a beverage company switches from virgin PET to 50% recycled PET (rPET):
-
It directly reduces demand for fossil feedstock.
-
It avoids emissions associated with primary polymerization.
-
Studies suggest reductions ranging from 12% to over 80%, depending on recycling technology and energy mix.
This explains why increasing recycled content is one of the most effective decarbonization strategies in plastic packaging.
Bottle Production: Energy-Driven Impacts
The second-largest contributor is the Bottle Production (BP) phase.
Here, PET resin is converted into preforms through injection molding and then shaped into bottles using stretch-blow molding at temperatures around 260–280°C.
Electricity use dominates this phase.
Example of Improvement
A lightweighting initiative reducing bottle weight by 20% results in:
-
Lower resin demand
-
Reduced molding energy consumption
-
Lower transport emissions due to weight reduction
In one cited case, a 20% weight reduction led to roughly 21% lower carbon emissions — demonstrating how design innovation directly translates into environmental benefit.
Distribution: Distance Matters
Although not the highest contributor overall, Distribution and Transportation (DT) showed a clear relationship between transport distance and GWP.
The study observed a near-linear relationship (R² = 0.964) between distance traveled and carbon emissions. This confirms that transportation emissions scale proportionally with distance and weight.
Real-World Illustration
Transporting bottled water:
-
60 km → minimal transport emissions
-
750 km → significantly higher GWP
This explains why locally bottled water often has a lower footprint than imported bottled water — even when the bottle design is identical.
It also highlights the importance of:
-
Rail over road transport
-
Electric fleets
-
Regional production facilities
Waste Management: A Story of Variability
Waste Management (WM) showed substantial variability across studies.
Three primary disposal routes were analyzed:
-
Mechanical recycling
-
Incineration (with or without energy recovery)
-
Landfilling
Interestingly, landfill scenarios sometimes appeared to have relatively low GWP within a 100-year time horizon because PET does not biodegrade quickly. However, this does not imply landfill is environmentally preferable — it simply reflects how carbon accounting works within defined temporal boundaries.
Recycling vs Incineration
-
Mechanical recycling consistently showed the lowest emissions.
-
Chemical recycling had higher emissions but allows higher-quality material recovery.
-
Incineration increased GWP significantly, even when energy recovery was considered.
Closed-loop recycling (bottle-to-bottle) produced the greatest environmental benefit because it directly offsets virgin PET production.
This reinforces the circular economy principle: keeping material in use is far more climate-efficient than recovering energy from it.
Environmental Benefits: Credits with Uncertainty
Environmental Benefits (EB) represent avoided emissions due to recycling or energy recovery.
This phase showed the highest coefficient of variation. Why?
Because each study modeled different end-of-life scenarios:
-
High-recycling European countries showed strong emission credits.
-
Regions dominated by landfill showed minimal environmental benefit.
This variability demonstrates how policy, infrastructure, and consumer behavior directly influence product-level carbon footprints.
Validation Against Market Data
To ensure robustness, the meta-analysis results were compared against national Environmental Product Declaration (EPD) data from Korea.
The EPD system follows internationally recognized standards such as:
-
ISO 14040
-
ISO 14044
-
ISO 14025
The Korean EPD average for PET bottles was:
5.424 kg CO₂-eq per kg
The meta-analysis result:
5.093 kg CO₂-eq per kg
A difference of approximately 6.5% indicates strong methodological reliability.
This alignment suggests that meta-analysis can produce decision-grade insights comparable to certified product declarations.
Bottle Size and Packaging Efficiency
When normalized per 100 mL of water, the average emission was:
17.3 g CO₂-eq per 100 mL
A clear pattern emerged:
-
Smaller bottles (e.g., 0.33 L) had higher emissions per 100 mL.
-
Larger bottles (e.g., 2 L) had lower emissions per 100 mL.
This is due to packaging efficiency — larger bottles use proportionally less plastic per unit of water delivered.
For example:
-
Two 0.5 L bottles require more total plastic than one 1 L bottle.
-
Therefore, larger formats are more carbon-efficient per liter.
This insight has implications for retail strategy and sustainable product design.
What This Means for Sustainable Packaging Strategy
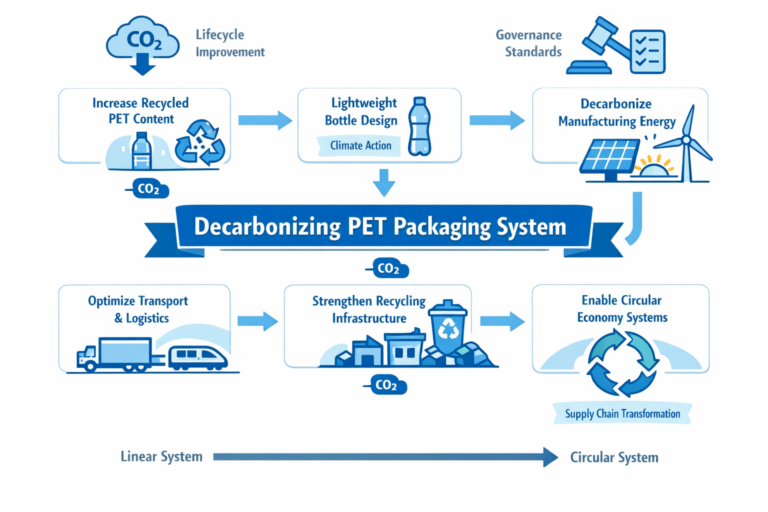
The descriptive findings of this meta-analysis reveal a clear hierarchy of action:
-
Prioritize recycled PET integration
-
Invest in lightweight bottle design
-
Decarbonize energy used in production
-
Optimize transport logistics
-
Improve recycling infrastructure
Most importantly, the study demonstrates that the majority of emissions occur before the consumer even opens the bottle.
The climate impact is largely embedded in materials and manufacturing.
Final Reflection
This meta-analysis does more than aggregate numbers — it clarifies where intervention is most effective.
It shows that:
-
Material production is structurally carbon-intensive.
-
Recycling is essential for meaningful emission reduction.
-
Transport distance matters but is secondary to material choice.
-
Circular systems outperform linear disposal pathways.
By harmonizing global LCA studies into a unified framework, this research provides a scientifically grounded roadmap for reducing the carbon footprint of PET water bottle systems.
Source: This analysis is based on the peer-reviewed article published in Sustainability (MDPI), 2024 — Meta-Analysis of Life Cycle Assessment Studies for Polyethylene Terephthalate Water Bottle System
Available at: https://www.mdpi.com/2071-1050/16/2/535